Εικόνες για study
Η γραφική παράσταση της \(υ=4συν(20t+\frac{π}{2}) \quad (S.I.)\)
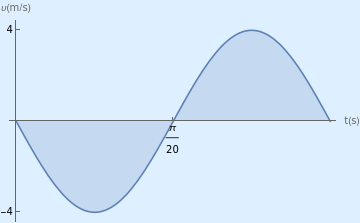
Ο κώδικας σε Mathematica
Plot[-4*Cos[20*t+Pi/2], {t, 0, Pi/10},
     PlotLegends -> "Expressions",
     PlotRange -> All,
     Background -> LightBlue,
     AxesLabel -> {"t(s)", "υ(m/s)"},
     Ticks -> \{\{0, π/20\}, \{-4, 4\}\},
     Filling -> Automatic]
Η γραφική παράσταση της \(α=-50ημ(5πt+\frac{π}{2}) \quad (S.I.)\)
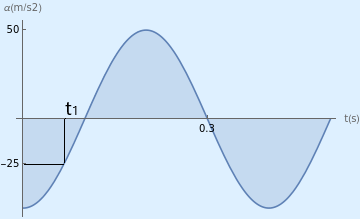
Ο κώδικας σε Mathematica
Plot[-50*Sin[5*Pi*t+Pi/2], {t, 0,0.5},
     PlotLegends -> "Expressions",
     PlotRange -> All,
     Background -> LightBlue,
     AxesLabel -> {"t(s)", "α(m/s2)"},
     Ticks -> \{\{0, 0,3\}, \{-25, 50\}\},
     Filling -> Automatic]
Η γραφική παράσταση της \(φ=20t + \frac{π}{2} \quad (S.I.)\)
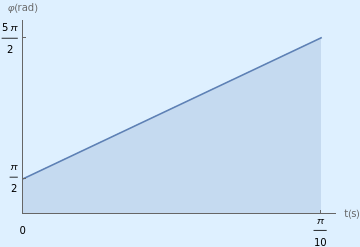
Ο κώδικας σε Mathematica
Plot[20*t + Pi/2, {t, 0, Pi/10},
	PlotLegends -> "Expressions",
	PlotRange -> \{\{0, Pi/9.5\}, \{0,5.5Pi/2\}\},
	GridLines -> Automatic,
	Background -> LightBlue,
	AxesLabel -> {"t(s)", "φ(rad)"},
	Ticks -> \{\{0, 0,3\}, \{-25, 50\}\},
	Filling -> Automatic]
Η γραφική παράσταση της \(υ=συν(πt+\frac{π}{2}) \quad (S.I.)\)
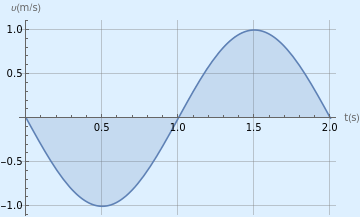
Ο κώδικας σε Mathematica
Plot[Cos[Pi*t+Pi/2], {t, 0, 2},
	PlotLegends -> "Expressions",
	PlotRange -> All,
	Background -> LightBlue,
	GridLines -> Automatic,
	AxesLabel -> {"t(s)", "υ(m/s)"},
	Filling -> Automatic]
Η γραφική παράσταση της \(α=-5ημ10t \quad (S.I.)\)
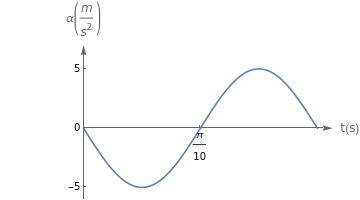
Ο κώδικας σε Mathematica
style=Style[α[(m/(s^2))],"style"]
Plot[-5*Sin[10*t], {t, 0, 0.2π},
	PlotLegends -> "Expressions",
	PlotRange -> \{\{0,0.67\},\{-6, 7\}\},
	GridLines -> Automatic,
	AxesStyle -> Arrowheads[{0.0, 0.04}],
	Ticks -> \{\{0, π/10\}, \{-5,0, 5\}\},
	AxesLabel -> {
		Style["t(s)", FontFamily -> "Zapfino", FontSize ->12],
		Style[style, FontFamily -> "Zapfino", FontSize -> 12]                       }]
Η γραφική παράσταση της \(F=-40συν10πt \quad (S.I.)\)
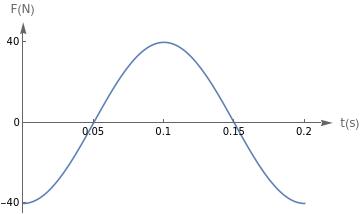
Ο κώδικας σε Mathematica
Plot[-40*Cos[10*Pi*t], {t, 0, 0.2},
	PlotLegends -> "Expressions",
	PlotRange -> \{\{0,0.22\},\{-45, 50\}\},
	GridLines -> Automatic,
	Ticks -> \{\{0, 0.05, 0.1,0.15, 0.2\}, \{-40,0,40\}\},
	AxesStyle -> Arrowheads[Medium],
	ImagePadding -> All,
	AxesLabel -> {
		Style["t(s)", FontFamily -> "Zapfino", FontSize ->12 ],
		Style["F(N)", FontFamily -> "Zapfino", FontSize -> 12]                       }]
Η γραφική παράσταση της \(U=4ημ^26.25πt \quad (S.I.)\)
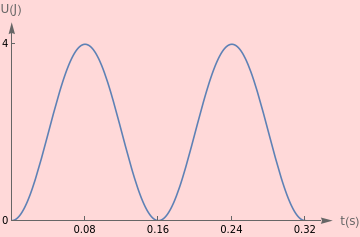
Ο κώδικας σε Mathematica
Plot[4*(Sin[6.25\[Pi]*t])^2, {t, 0, 0.32},
	PlotLegends -> "Expressions",
	PlotRange -> \{\{0,0.35\},\{0, 4.5\}\},
	GridLines -> Automatic,
	Background -> LightRed,
	Ticks -> \{\{0.08,0.16,0.24,0.32\}, \{0,4\}\},
	AxesStyle -> Arrowheads[Medium],
	AxesLabel -> {
		Style["t(s)", FontFamily -> "Zapfino", FontSize ->12 ],
		Style["U(J)", FontFamily -> "Zapfino", FontSize -> 12]
				}]
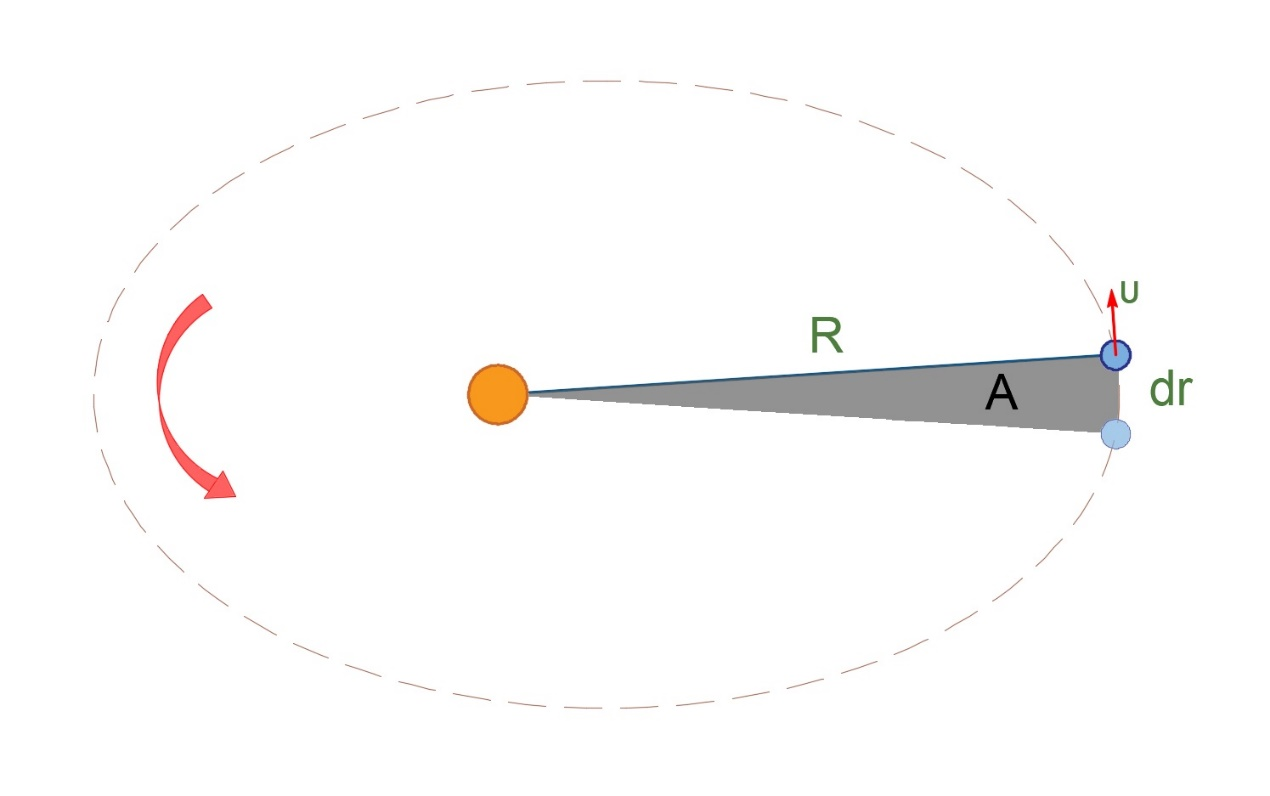
Στροφορμή υλικού σημείου
blog comments powered by Disqus